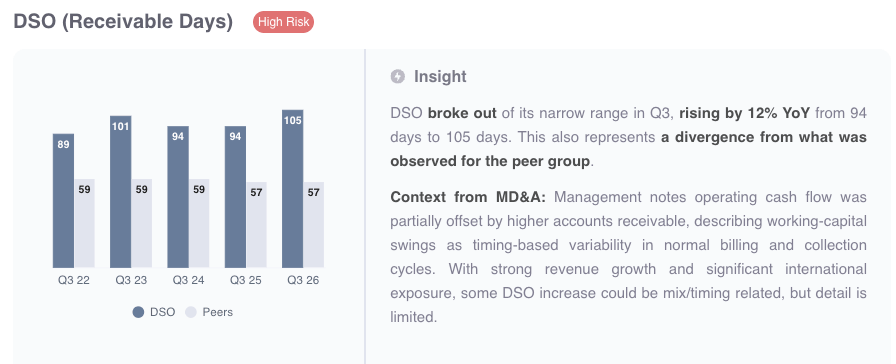
Commvault released Q3 earnings on Tuesday. While the numbers themselves were strong, the market was disappointed with the level of net new ARR achieved in the quarter. The perceived shift was taken badly and the stock plummeted. Meanwhile, and separate to this dynamic, our system has identified a growing number of red flags from the 10-Q filing as our risk rating moves from a '7' to a '10'. The key driver of this change was DSO, which has risen to a five-year high of 105 days on our calculation (see chart below).
Looking closer at the 10-Q we can see that "Accounts Receivable" has increased by 42% in the past 9 months. Almost all of this movement has occurred in the latest quarter. In addition we see a similar increase in “Unbilled Receivables” (see extract from disclosure below), a line item which represents revenue recognized but not yet billed to the customer.
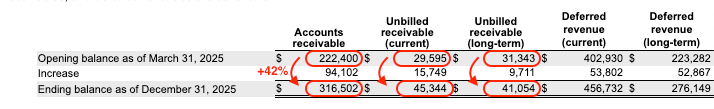
Combined, billed and unbilled receivables now represent over $400m. This makes it the second largest item on the balance sheet (after cash) and the equivalent of 118 days of sales. That’s a huge amount of revenue that’s already been recognized in the income statement, but which has not yet converted into cash.
Management was asked directly about elevated DSO on the call and the Cheif Accounting Officer put it down to the fact that Q3 (being the end of the calendar year) tends to see more deals being signed at the end of the quarter.
“...one of the things we saw this quarter, and it’s not uncommon in Q3, I’ll be honest. Q3 has a tendency to be one of our most pressured free cash flow quarters. And it’s really just because of the way the sales cycles work with the calendar year-end, we have a tendency to see more deals close in the last few weeks of the quarter and this quarter was no exception to that. I can tell you, over 60% of our deals actually closed in the last few weeks of the quarter.”
Danielle Abrahamsen, Chief Accounting Officer
While this explains why DSO is higher than in Q4, it doesn’t explain why DSO is significantly higher compared to Q3 24 and Q3 25.
Sharply rising DSO can mean a number of things, including timing issues or weak collection. But it is often viewed as a red flag due to its association with aggressive revenue recognition. This is particularly the case where it’s accompanied by a rise in “unbilled receivables” as observed here. Since unbilled receivables are based on calculations and estimates of amounts due, it can be a powerful lever in accelerating revenue recognition.
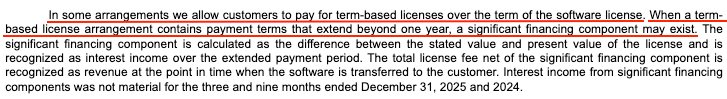
In this case we also see that a significant proportion of this unbilled balance (nearly 50%) is classified as “long-term”, implying that the revenue recognized is not expected to translate to cash for over 12 months. One interesting disclosure in the notes to the accounts (extract below) suggests that this balance may be connected to providing extended credit terms to customers. Such tactics can help stimulate sales (at least in the short run) but elevates collection risk and hurts cash flow.
A second important flag is the increasing value of “Deferred Commissions”, which represents sales commissions paid to employees, but capitalized on the balance sheet rather than expensed. This is allowable per US Gaap, but a sharp increase can suggest aggressive capitalization. The filings show this balance has risen by 40% YoY from $68m in Q3 24 to $95m in Q3 25. While we would expect deferred commissions to increase broadly in line with activity, in this case, we can see it has risen much faster than sales.
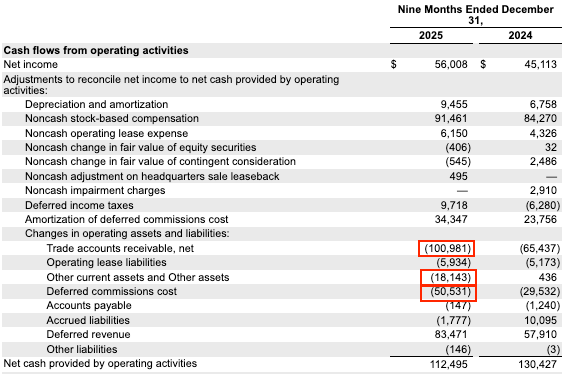
The expansion of the balance sheet has weighed on cash flow this year and contributed to its weakness. The impact of growing receivables alone has had an impact of $100m in the 9 month period, as we can see in the extract of the statutory cash flow statement from the 10-Q (see below). Note that the impact has been partially mitigated, thanks only to the increase in “deferred revenue”, which is likely a function of a growing SAAS business (where the client typically pays up front).
Investors who have been following Commvault for some time will know that the CFO role has seen an unusual amount of churn in recent years. After longstanding CFO Brian Carolan resigned in July 2022, he was replaced by Gary Merrill, who was then reassigned as CCO 2 years later, in August 2024. His replacement, Jen DiRico lasted only 16 months, resigning in December 2025. This has left the company with no CFO while the company searches for a replacement. While this level of churn in itself doesn’t imply an issue with the books, when combined with a number of red flags in the filings, it certainly warrants a heightened level of caution.
Our machine intelligence helps Portfolio Managers to spot critical red flags hidden deep within the financial statements and governance disclosures.
Forensic Alpha uses proprietary machine intelligence to identify risks hidden deep within the financial statements and governance disclosures.
Forensic Alpha Limited
Level 39, One Canada Square
Canary Wharf
London E14 5AB
Forensic Alpha US INC
12 East 49th Street
New York
NY 10017
USA