Accounting at FTAI has already been well covered by activist short-seller reports, a large part of it focusing on the purported transfer of assets between the aerospace and leasing divisions in order to optimize margins in the Aerospace division. The stock came onto our own radar this week when the score moved up a notch to a rating of ‘8’ following the publication of the 10-Q on Wednesday.
Our panel was already showing flags for an accounting policy change in 2024 as well as changes to the risk factor wording. With the Q3 filing, we also identified flags for inventory and receivables.
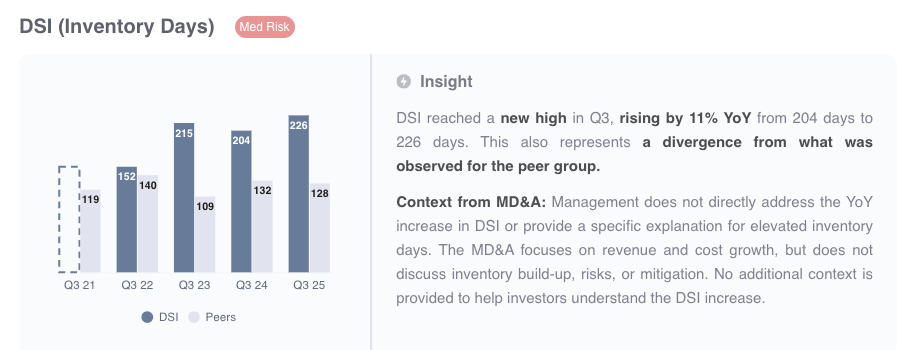
In particular, inventory saw a sharp increase from $551m to $897m (+63%). DSI now stands at 226 days (see chart from our report below). This seems to be at odds with the company’s shift to an ‘asset-light’ strategy as it liquidates its portfolio of leased assets. It also brings with it an increased risk of obsolescence and write-offs.
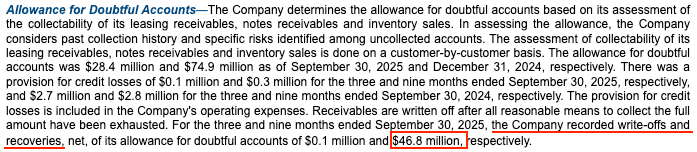
At the same time, receivables are also on the rise. We see this in the accounts receivable line, which has grown from $115m at year-end to $166m in Q3 (+44%). This actually understates the underlying trend, since the notes to the 10-Q (see extract below) indicate that the company wrote off $47m of receivables during the period. Absent this write-off, receivables would have grown by +74% in the past nine months.
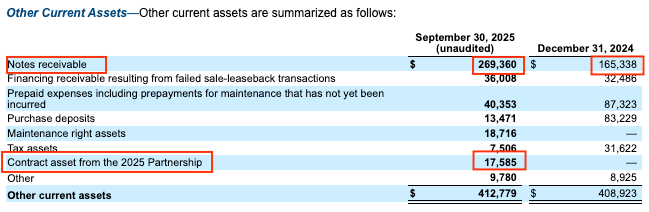
Furthermore, we also see a 63% increase in “notes receivable”, which are disclosed in the notes to the accounts under “Other current assets” (see disclosure from the 10-Q below). It’s not clear exactly how these originated, but they are likely customer-related. The ‘contract asset’ item further down represents revenue booked on sales but which have not yet been invoiced to the customer.
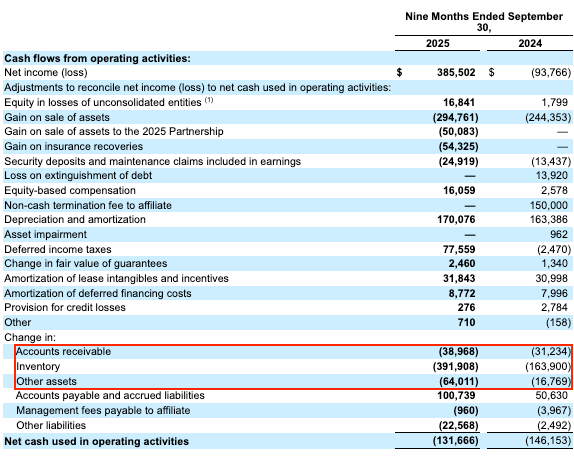
The result of these movements is that the size of the balance sheet has been broadly static, despite the sale of $500m leasing assets in pursuit of an asset-light strategy. The sale of these assets has been approximately offset by the increase in working capital over the past nine months. The strain of working capital is evident from the cash flow statement (extract shown below), where we see an impact of around $500m from accounts receivable, inventory and other assets over the 9 month period.
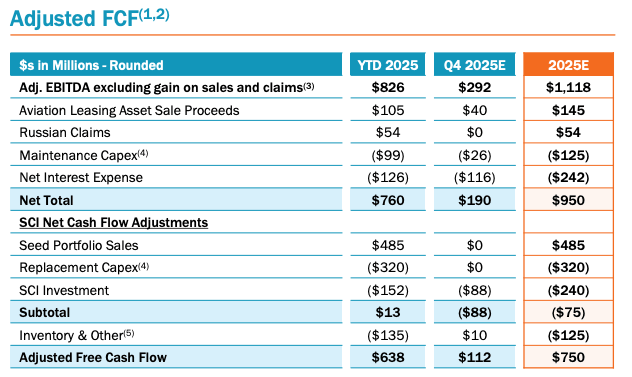
The picture painted by the statutory cash flow statement is very different to management’s own measure of “adjusted free cash flow” (see extract from Q3 presentation below) which indicates healthy cash generation both before and after the impact of capex and portfolio sales. There is little evidence of the burden from working capital, with the item “Inventory & Other” showing a negative impact of just $135m
At the end of 2024, FTAI set up the Strategic Capital Initiative (“SCI”) in order to acquire assets from the FTAI leasing business. Under the SCI, the company this year launched the “2025 Partnership” - a series of SPVs in which FTAI have an ownership stake of 19%.
As part of the 2025 Partnership, FTAI has also entered into an agreement to provide MRE services (Maintentance, Repair and Exchage) to the SPV, which “requires the Company to sell serviceable engines and modules and purchase unserviceable engines and modules from the SPVs when aircraft controlled by the SPVs need such serviceable engines and modules to fulfill their obligations under an aircraft lease”. In the 10-Q filing, FTAI disclosed that they generated $229m of revenues in the first nine months of the year from these MRE services. This revenue is included within the “Aerospace Products” division.
The Strategic Capital Initiative therefore serves two key purposes for FTAI - it provides a way to move leasing assets off the balance sheet, and at the same time provides a captive market for the sale of its MRE services.
It should be noted here that FTAI itself is acting as the “servicer” of the SPVs, meaning it is both the buyer and seller under these MRE contracts. We imagine this gives them a good degree of control, both in terms of the timing and volume of business. The arrangement might also increase the risk of aggressive revenue recognition since we would reasonably expect them to have more control over the conditions that need to be met for a sale to be recognized. On this note, disclosure in the 10-Q suggests that a high proportion of the $229m revenue booked has not yet translated into cash as at the end of Q3. Accounts receivable from the 2025 Partnership amount to $51m, in addition to a contract asset of $18m (i.e. revenue that was booked but not yet invoiced).
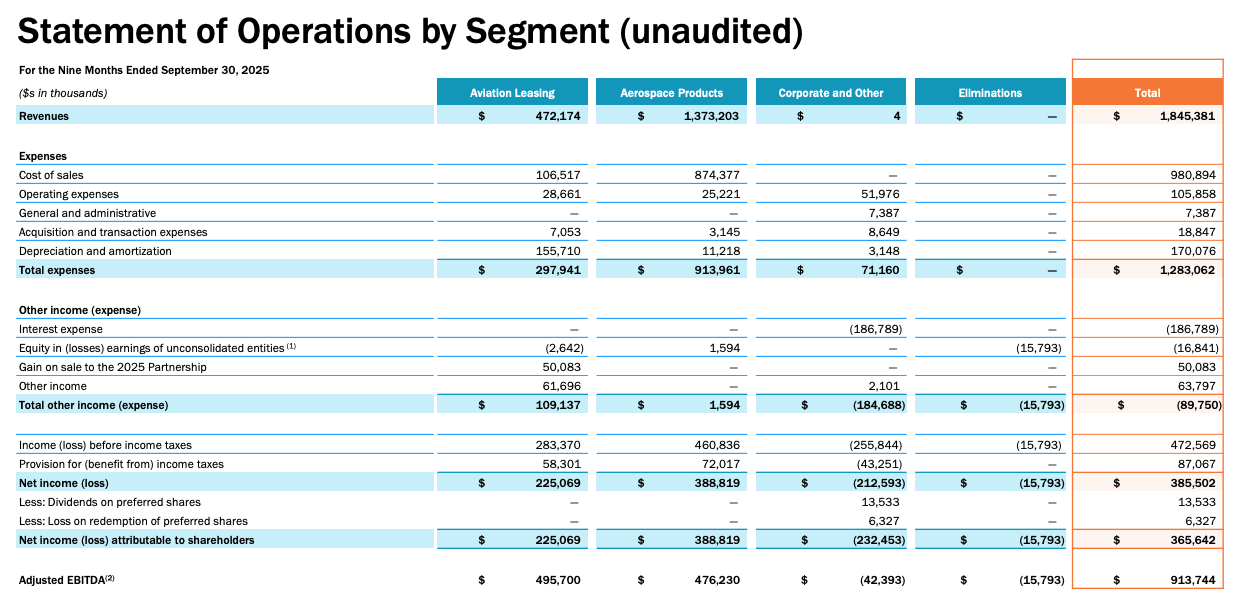
In understanding the income being generated from MRE sales to the SPV, it is important here to explain a certain technicality of US Gaap. This requires that where the profit on the underlying product has not yet been realized by an investee (in this case the SPV), FTAI is required to defer that portion of the profit corresponding to its holding (in this case 19%). This is why we see a $16m deduction in the ‘elimination’ column on slide 27 of the Q3 presentation. Note that while this impacts the overall EBITDA margin, it is presented in a way that it does not impact the Aerospace Products margin. Interestingly, if we gross up the elimination to 100% ($83m) and compare it to revenues of $229m this implies a 36% net profit margin on the revenue generated from the SPV, quite a bit higher than the 28% net profit margin for the Aerospace business as a whole for the 9m period.
The introduction of the SPVs raises a lot of questions around conflicts of interest and reduces transparency around the true end-demand for FTAI’s products and services. However in the short to medium-term we imagine the company will leverage these arrangements to full effect, both as a source of capital and as a driver of earnings. We can expect the relationship to become far more material to the overall numbers in coming quarters. Investors should look to the GAAP disclosure in the SEC filings for a true representation of how this arrangement impacts on earnings and cash flow. In particular the 10-K filing should provide more granular disclosure about the 2025 Partnership and the arrangements made as part of it.
Our machine intelligence helps Portfolio Managers to spot critical red flags hidden deep within the financial statements and governance disclosures.
Forensic Alpha uses proprietary machine intelligence to identify risks hidden deep within the financial statements and governance disclosures.
Forensic Alpha Limited
Level 39, One Canada Square
Canary Wharf
London E14 5AB
Forensic Alpha US INC
12 East 49th Street
New York
NY 10017
USA