We’re starting the new year with an exciting new release as we deploy our “Adjusted Earnings” module. This represents a major new enhancement to our existing forensic accounting product and a step-change in how we use AI to draw insights from granular data. By capturing quarterly gaap reconciliations over the past 6 years we can generate deep insights into how a company presents its adjusted earnings, make judgements about the validity of those adjustments and observe how those adjustments have changed over time. For the first time we are also incorporating interactive elements into our report, giving clients greater control over how these insights are displayed.
The module has initially been released for the 2,400 US companies we have under coverage. We are planning to roll this out to our European and Asian universe over the course of the next 1-2 months.
Our system is based on quarterly gaap reconciliations pulled from the 8-K filings. From these reconciliations we create a continuous record of itemised adjustments, each one assigned to a specific category. Guided by our proprietary AI system, we determine the validity of each adjustment made and identify any specific risks associated with each adjustment.
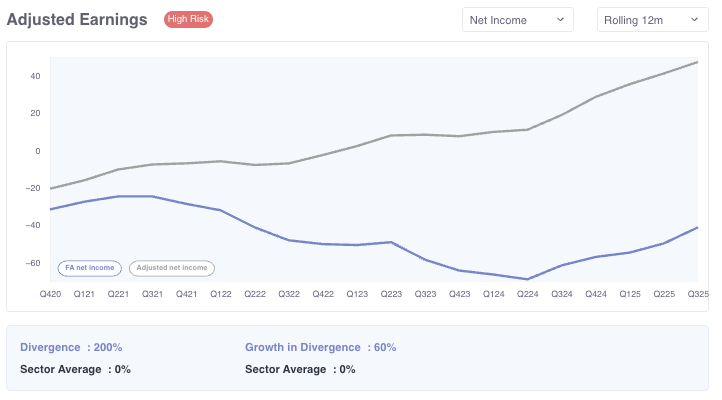
As seen here, the system generates a chart, which the user can toggle between "Quarterly" and "Rolling 12 months". The chart tracks the company’s adjusted earnings versus Forensic Alpha’s own measure of earnings (based on what adjustments are deemed reasonable). We flag companies where there is a wide and growing divergence between the two metrics. In the example below we can see that while the company’s adjusted earnings are growing strongly and have shifted from negative to positive, our own measure shows persistent losses.
The central panel below the chart displays some additional stats: “Divergence” and “Growth in Divergence”, both of which are compared to equivalent metrics for the sector as a whole.
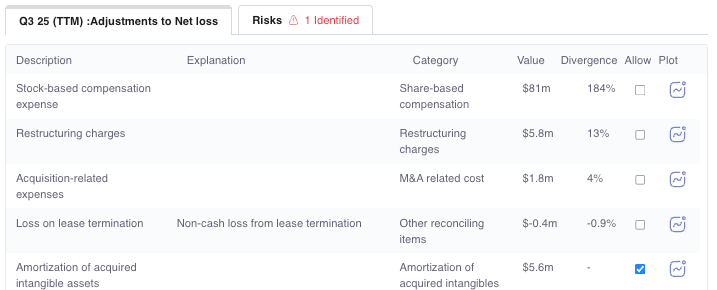
In the lower panel (see screenshot below) the client can see the itemised adjustments being made to statutory numbers. By default the adjustments are displayed on a “Rolling 12m” basis (i.e. last 4 quarters), but the client can also view these on a quarterly basis (the setting can be changed in the dropdown in the top right). Each adjustment has been sorted into a specific "Category” and any details provided by the footnotes are explained in the “Explanation” column. The user can also see at a glance the “Value” of the adjustment and the contribution to the “Divergence”.
Adjustments that are deemed valid “allowable” adjustments are checked in the “Allow” column. Adjustments which are not deemed valid are left unchecked. For example, in this case, the “Amortization of acquired intangibles” is considered a valid adjustment, while the add-back of “Stock-based compensation expense” is not considered valid.
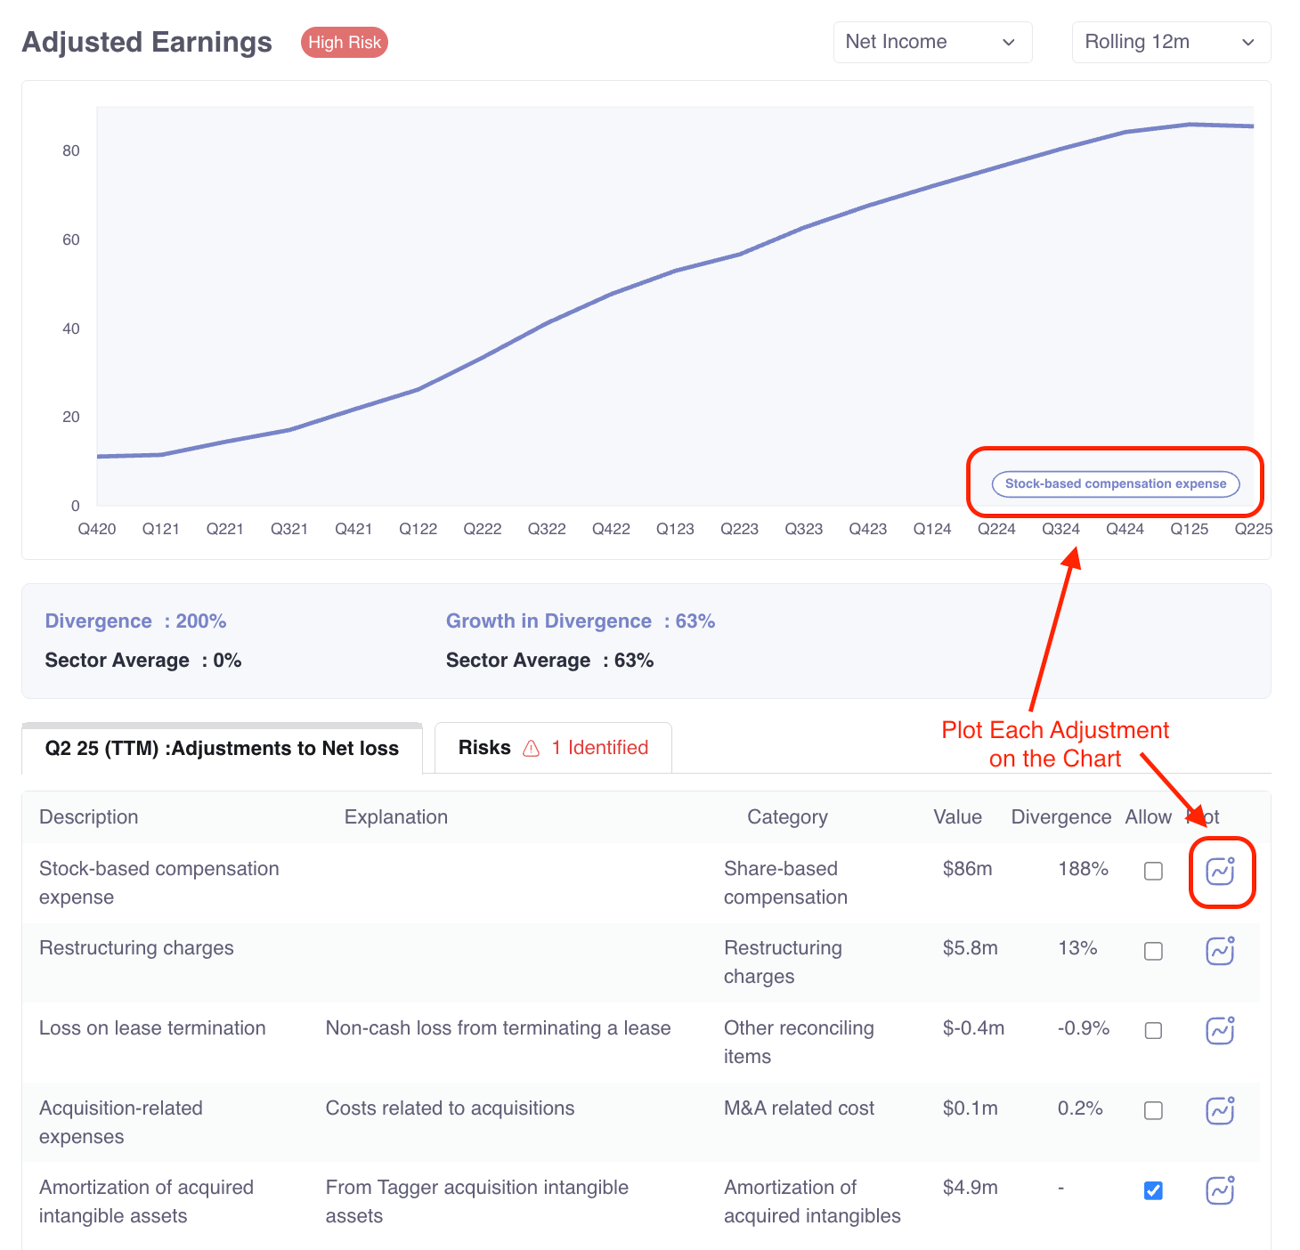
The user can directly adjust what is considered allowable by checking or unchecking these boxes. The chart will then adjust to show an updated measure of adjusted earnings. (Note that any tax impact associated with the adjustments is estimated and automatically calculated by the system.)
The “Plot” button on the far right side then allows the client to analyse the historical trend in that individual item over time. In this case for example, by plotting “Stock-based compensation expense” we can observe how this particular expense has risen sharply over time, contributing to the widening gap between statutory and adjusted earnings.
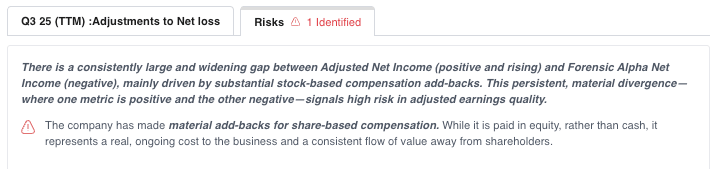
In the lower panel, the client can toggle between the “Adjustments” view and the “Risks” view. This view (example shown below) provides a narrative description of the size and validity of adjustments and provides more detail on adjustments which are particularly sizable or which have recurred frequently over the past 5 years. Here we will also pick up on any changes in the methodology over time or any specific risks picked up from the footnotes.
Our machine intelligence helps Portfolio Managers to spot critical red flags hidden deep within the financial statements and governance disclosures.
Forensic Alpha uses proprietary machine intelligence to identify risks hidden deep within the financial statements and governance disclosures.
Forensic Alpha Limited
Level 39, One Canada Square
Canary Wharf
London E14 5AB
Forensic Alpha US INC
12 East 49th Street
New York
NY 10017
USA